Crop Insurance Harvest Reminders
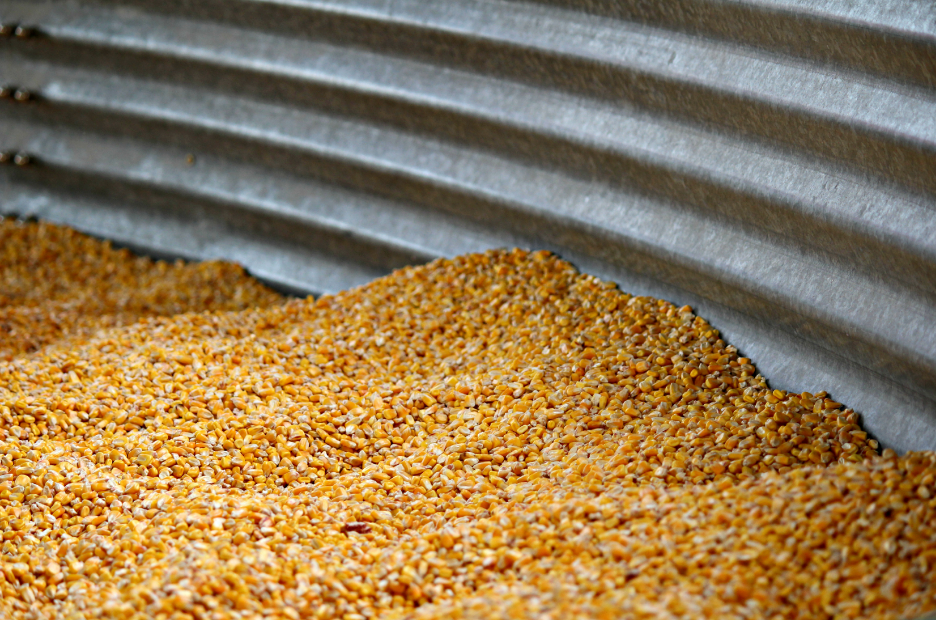
Below are a few crop insurance reminders for the upcoming 2021 harvest season. Appraisals Chopping Silage: Need to get an appraisal if you have loss. Need to get an appraisal if you chop more than 50% of the unit. It is beneficial to get an appraisal in any situation. Grain Bin Measurements: Need to have [...]


Get Social