
Can’t predict the future…. but can review historical data to see how Enhanced Coverage Option would have paid in the past.
Below are charts that look back to see the number of years ECO would have triggered and the number of years the full ECO payment would have been paid. The last column provides a ratio of ECO Payments vs. ECO Premium on an “average” farm. Since the year 2000, ECO would have triggered more in payments than premium. (Results don’t include 2020, as county yields have not been finalized.)
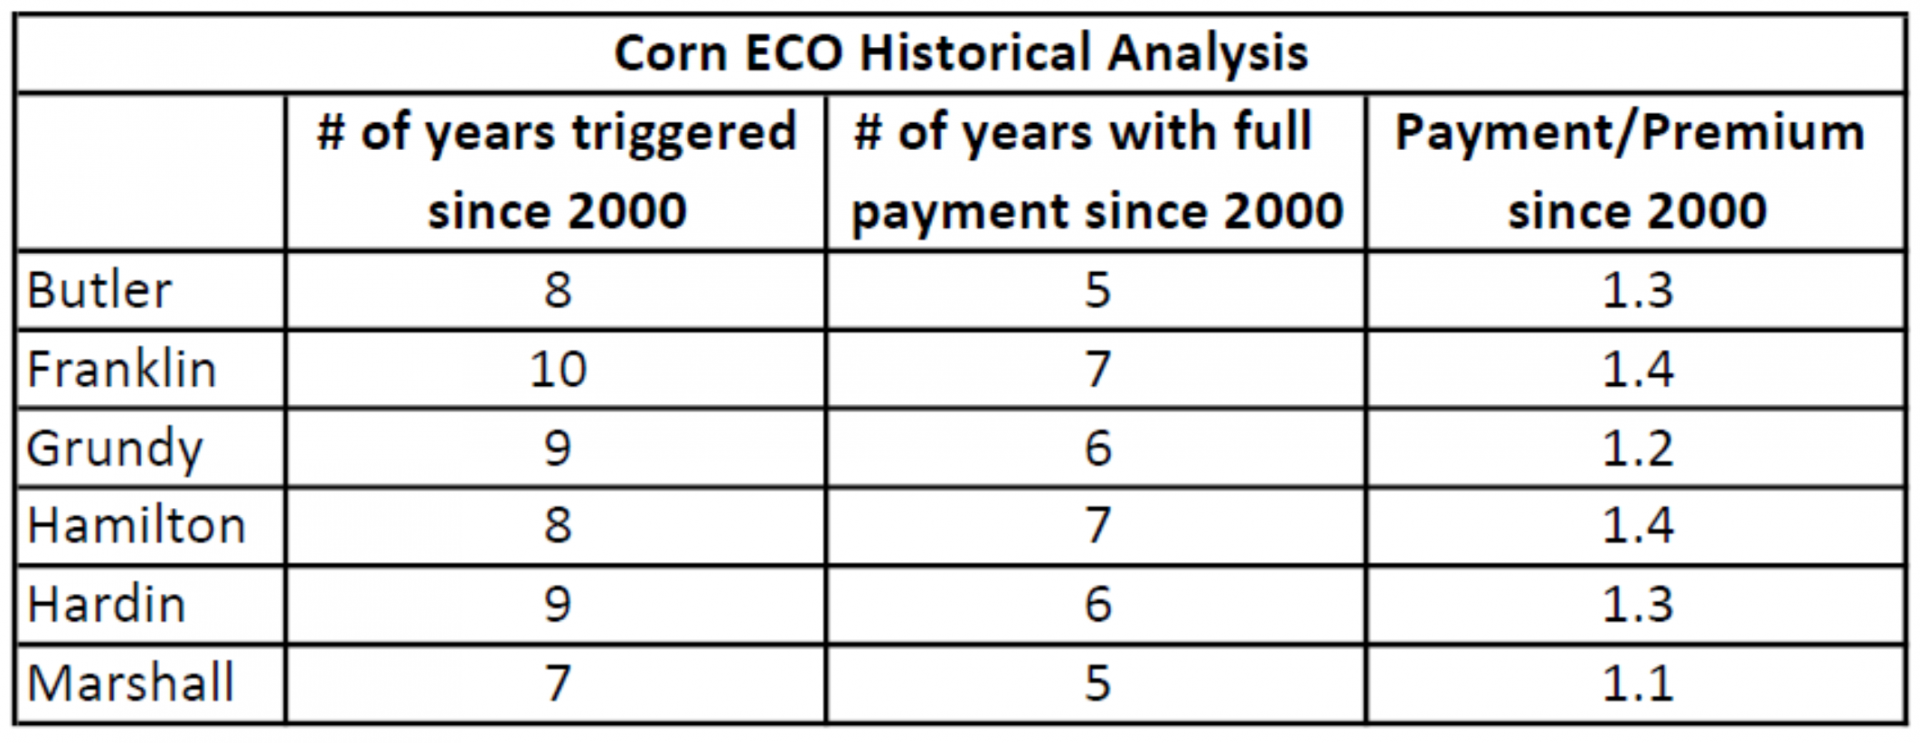
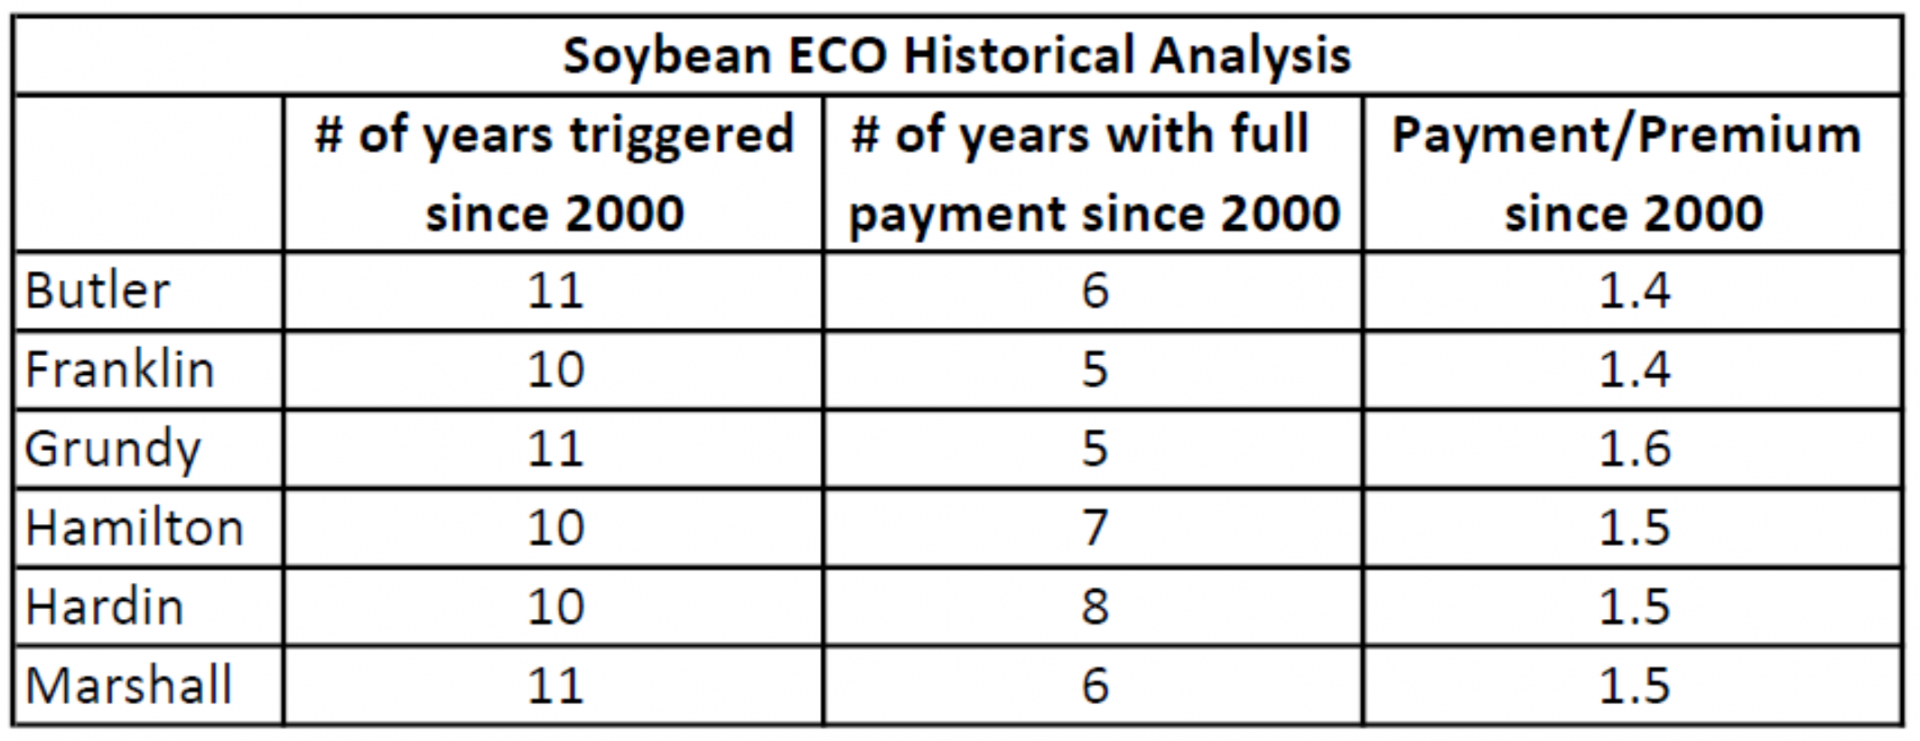
When reviewing the ECO ratio of coverage to premium on an “average” farm in our area, it is ranging from 3.0-3.6.This is an attractive ratio for top end crop insurance coverage. This is mostly contributed to the combination of 44% premium subsidy and being a county based product. 2021 ECO pricing is pending the Projected Price and volatility that will average in the month of February.
Consider the cost of ECO vs protecting your crop with put options. ECO not only offers price protection at a competitive rate, but also offers yield protection component.
Does your farm typically out perform the county, trend with the county, or under perform against the county? I suggest reviewing ECO on your farm to see if the value of coverage makes sense for you. As a reminder, the dollar amount of ECO coverage is determined based upon your individual APH. See my blog post Determining ECO Dollar Per Acre Coverage for more information.


Get Social