
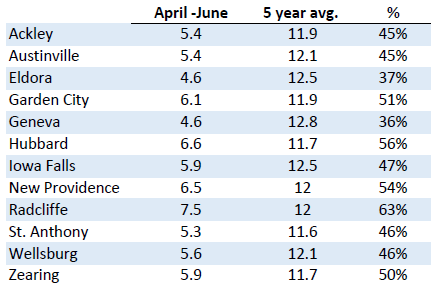
Below is a graph showing precipitation from April 1, 2021 to June 28, 2021 compared to the 5 year average.
Below is a graph showing precipitation from June 28, 2020 to June 28, 2021 compared to the 5 year average.
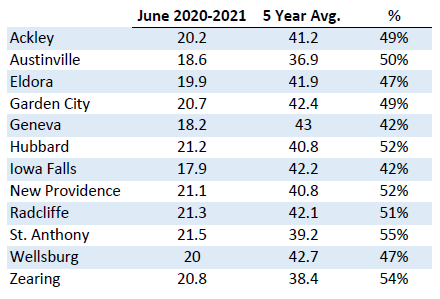
Precipitation is based off www.climate.com.


Get Social